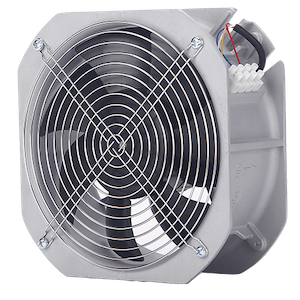
FOCUS ON EC FAN ONLY
FOCUS ON EC FAN ONLY
In industrial ventilation and cooling systems, selecting the right axial fan is not simply a matter of choosing a diameter or motor power. For factory managers and technical decision-makers, performance accuracy directly impacts system efficiency, energy consumption, and long-term operational stability.
A clear understanding of the axial fan performance curve is essential when evaluating airflow capacity, pressure capability, and overall system compatibility. Misinterpreting this curve can result in insufficient airflow, excessive noise, premature motor wear, or unnecessary energy costs.
This article provides a technical breakdown of how to read and apply axial fan performance data—focusing on axial fan CFM, axial fan pressure, and the relationship between airflow and static pressure—to help you make informed procurement and engineering decisions.
An axial fan performance curve is a graphical representation of a fan’s operating characteristics under specific test conditions. It illustrates the relationship between:
Airflow (CFM or m³/h)
Static pressure (Pa or in. w.g.)
Efficiency
Power consumption
Sometimes noise levels
The curve is generated through standardized laboratory testing and reflects how the fan performs across its operating range.
For factory environments—such as HVAC systems, process cooling, dust extraction, or equipment ventilation—this curve is the foundation for correct fan selection.
Axial fan CFM (Cubic Feet per Minute) measures the volume of air the fan moves. It represents airflow capacity under specific resistance conditions.
In industrial settings, required CFM depends on:
Heat load from machinery
Required air changes per hour (ACH)
Space volume
Process ventilation demands
Environmental regulations
Important principle:
CFM alone does not determine performance. Airflow must be evaluated together with static pressure.
Axial fan pressure refers to the resistance the fan must overcome to move air through a system. It is typically measured as static pressure.
Sources of system resistance include:
Ductwork length and diameter
Filters
Heat exchangers
Dampers
Louvers
Equipment enclosures
As system resistance increases, airflow decreases. This inverse relationship is reflected directly on the performance curve.
For factory managers, underestimating static pressure is one of the most common causes of ventilation system underperformance.
The true operating condition of a fan is determined by the intersection between:
The fan performance curve
The system resistance curve
This intersection is called the operating point.
If the operating point falls:
Too far left → insufficient airflow
Too far right → unstable operation and overload risk
Outside efficient range → energy waste
Proper system design ensures the fan operates near its peak efficiency zone.

A typical axial fan curve shows:
X-axis: Airflow (CFM or m³/h)
Y-axis: Static Pressure (Pa or in. w.g.)
Additional curves: Efficiency %, Power (kW), sometimes sound levels
At zero static pressure (free air condition):
Airflow is at its maximum.
Pressure is zero.
This does NOT represent real-world ducted systems.
Many selection errors occur when buyers select a fan based only on free-air CFM ratings.
At the far left of the curve:
Airflow is minimal.
Static pressure is highest.
The fan is near stall condition.
Operating continuously near this point can cause:
Increased vibration
Noise spikes
Reduced lifespan
Motor overload
The optimal region of the curve is known as the Best Efficiency Point (BEP).
Operating near BEP ensures:
Lower power consumption
Reduced mechanical stress
Lower noise
Longer service life
For industrial facilities running fans 24/7, efficiency improvements directly translate into measurable cost savings.
When selecting an axial fan for industrial use, follow this structured approach:
Calculate required axial fan CFM based on:
Heat dissipation load
Required air change rate
Local compliance standards
Process ventilation requirements
Accurately estimate total system resistance including:
Duct friction loss
Filter pressure drop
Heat exchanger resistance
Entry and exit losses
Underestimating static pressure leads to chronic underperformance.
Identify the required airflow and pressure combination.
Locate that coordinate on the axial fan performance curve.
Ensure:
The point lies within stable operation range
It is close to BEP
Motor power rating supports the load with margin
Compare:
Input power at operating point
Motor efficiency (especially EC vs AC)
Long-term energy cost impact
For high-duty-cycle industrial applications, selecting a slightly more efficient fan can significantly reduce operating expenditure over time.
When paired with VFD or EC motors, axial fans can:
Adjust airflow dynamically
Shift operating point along curve
Reduce energy during partial load
This is especially beneficial for:
Seasonal ventilation systems
Smart factory environments
Temperature-controlled facilities
In high-demand industrial systems:
Fans in parallel increase airflow.
Fans in series increase pressure.
Performance curves must be recalculated for combined configurations to ensure stability.
Improper selection can push the fan into unstable zones:
Stall region: airflow separation
Surge: fluctuating pressure and flow
These conditions reduce reliability and increase maintenance frequency.
Factory procurement teams often encounter these errors:
Each mistake can increase capital cost and long-term energy expenses.
Understanding axial fan performance characteristics allows decision-makers to:
Improve system reliability
Reduce operational energy costs
Extend equipment lifespan
Minimize downtime
Avoid costly retrofits
In industrial environments where ventilation systems operate continuously, small selection errors can accumulate into significant financial losses.
Accurate curve interpretation is not optional—it is a core engineering responsibility.
The axial fan performance curve is more than a technical document—it is the roadmap to efficient, stable, and cost-effective ventilation system design.
By properly evaluating:
Axial fan CFM
Axial fan pressure
Operating point
Efficiency zones
factory managers and engineers can ensure their systems deliver the required airflow without energy waste or reliability issues.
If your current ventilation system is underperforming, consuming excessive energy, or facing premature wear, the root cause often lies in incorrect performance curve interpretation or mismatched fan selection.
At PBM, we specialize in high-efficiency EC axial fans and industrial ventilation solutions tailored for demanding factory environments. Our engineering team provides:
Customized performance curve analysis
Precise airflow and pressure matching
Energy-efficient EC motor integration
Application-specific fan design
Technical consultation for OEM and industrial projects
If you are planning a new project or upgrading an existing system, contact PBM today for a technical evaluation and performance optimization proposal.
Let’s build a ventilation solution that works exactly at your required operating point—efficiently, reliably, and sustainably.
 If you have any interest in our products,please feel free to contact us & we are ready to serve you

By continuing to use the site you agree to our privacy policy Terms and Conditions.